Worst-case coronavirus scenario: 214 million Americans infected, 1.7 million dead
Apr 7, 2020 02:26:57 #

Steven Seward wrote:
Well, it almost reached your projection. The count on Worldometers is now at 9,620, though I've noticed that they sometimes adjust it a couple days later when the timings on reported deaths are straightened out.
The model I was using was simply trying to fit a curve to the growth in death counts. That model looked quite accurate in the early phase, but a clear shortcoming is that it would continue growing progressively faster forever. That is not how viral infections behave over time.
A better approach is the SIR model. I found one online that was downloadable as an Excel spreadsheet. It generates that humped response for the number of individuals infected over time by calculating Susceptible, Infected and Recovered numbers. When using that model there are multiple parameters that can be adjusted to make the model fit the data. A key parameter is the Reproduction Number, which itself depends on Transmissibility, Duration of Infectiousness, and Contact Rate. The first two parameters might be fairly constant for a given virus, but Contact Rate is highly variable, especially if one institutes social distancing.
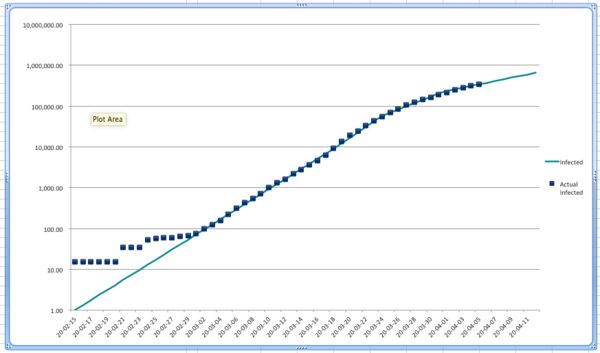
Below is a graph using the SIR model to predict the number of people infected. The growth in the number of infected is not very smooth early on (testing was too sporadic and limited), but beginning in March the growth rate seemed to be quite exponential (a straight line on the log plot). The "rounding over" hump started to become visible near the end of March. It looks like social distancing is working!!
I was able to bend the model prediction by changing the Contact Rate over time. I used an initial Contact Rate of 13, raised it to 14 on 18 Mar, then dropped it to 9 on 24 Mar, 7 on 31 Mar, and 6 on 2 Apr.
I don't intend to predict any further. I am now more interested in seeing if the model continues to track reality by adjusting the parameters. Hopefully I won't get to some silly result that says you need a negative Contact Rate to match the data. A good fit with reasonable interpretations of the parameters says the model has made the right mechanistic assumptions and relationships.
FYI, the model also calculates death numbers, but these are much harder to model and fit to the real data.
Apr 7, 2020 03:21:54 #

Steven Seward wrote:
What a bunch of garbage. I'd be surprised if 500 Americans died of it by the end of the flu season.
Eat your words.
Apr 7, 2020 07:18:28 #
mwsilvers
Loc: Central New Jersey
Steven Seward wrote:
I will refer you back to the "experts" ... (show quote)
That is what closing down everything is meant to prevent, and it seems to be having a positive effect. If we were still in "business as usual" mode things would be quite different.
Apr 7, 2020 09:17:37 #

Apr 7, 2020 09:59:04 #
JohnFrim wrote:
The model I was using was simply trying to fit a c... (show quote)
Thanks for doing the mathematical yoeman's work! I can add a couple of factors to the reported infection rate.
At the beginning of this thing there was a rollout of tests that proved to have bad chemical reagents in them and were called back. Within a short time they were replaced by more reliable tests and there was more or less enough to go around. However, when New York City broke out, testing kits were redistributed to their State and less were provided to the States with few problems. So many were being used in New York that there now is a shortage.
At my wife's hospital in Cleveland Ohio, they are capable of doing 1,000 tests a day with their trained staff, but are only provided with 240 test kits of the faster type test. One compounding factor is that these faster test kits are manufactured by an Italian company and they give priority to their own country when it comes to testing. However, the U.S. is providing Italy with equipment too, so they are trading off their valuable test kits since they have already tested more of a percentage in Italy than almost any other country.
Doctors in Ohio and other low-infection, low death-rate areas, are told to not refer people for testing who have only mild symptoms. They instruct their patients to simply go home and self-quarantine. This you would think, would mask some of the actual infection rate in Ohio and other areas, but it might not. In Cleveland, which is the "hot spot" of the state, only about 4% of those people with symptoms and referred by doctors are coming up positive for the virus. When testing health-care workers who have symptoms and people who are already in the hospital for something else and show symptoms, that rate is about 6%. State-wide the overall positive rate is 8% presumably because people in areas that are little infected don't bother going to the doctor unless they have severe symptoms.
Contrast this with New York which has a positive testing rate of 40% and New Jersey with 46%! I'm guessing they have so many cases there that they only test the most severe. Their actual infected rate may really be masked by this.
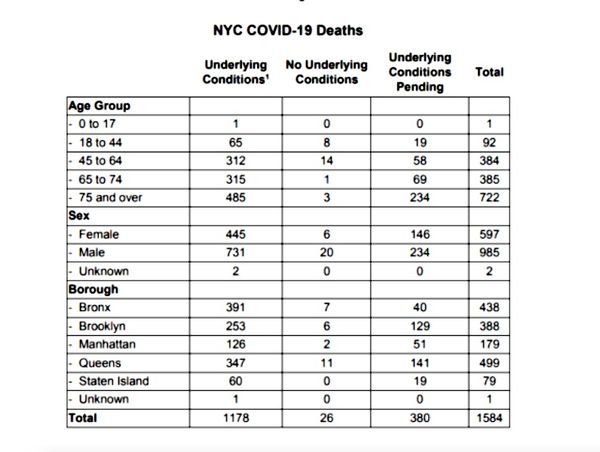
One other thing is that there is now some grumbling about what actually constitutes a legitimate death from the virus. Connecticut recently claimed that a seven week-old infant died from the disease, the first infant world-wide. It later turned out that the youngster was accidently suffocated by his care-giver, but a State-mandated Covid test at death turned up positive. People already dying or in hospice care who contract the virus are counted along with the others who die on ventilators. I don't know much about the veracity of these claims but the CDC's official guidelines on reporting Covid deaths states that any death where the disease “caused or is *assumed* to have caused or *contributed to* death.” Confirmed lab tests are not required…
Here is an eye-opening chart from a few days ago on how many of the dying in New York already had "underlying conditions."
Jun 15, 2021 10:24:10 #

Rose42 wrote:
Nah, worst case - NY and LA are hit with nuclear bombs.
People need to stop the fear mongering. Its irresponsible.
People need to stop the fear mongering. Its irresponsible.
My account is still here, so I will make use of it for this one comment,
That projection was not "fear mongering".
Even with all the mask wearing, social distancing, and vaccinations, the death toll has now passed one third of that estimate.
Jun 15, 2021 13:04:54 #
rehess wrote:
My account is still here, so I will make use of it for this one comment,
That projection was not "fear mongering".
Even with all the mask wearing, social distancing, and vaccinations, the death toll has now passed one third of that estimate.
That projection was not "fear mongering".
Even with all the mask wearing, social distancing, and vaccinations, the death toll has now passed one third of that estimate.
But the death rates are very misleading. They literally count everybody who dies who previously tested positive for Covid as being a Covid death, whether they really died of Covid or something else. Here is Dr. Deborah Birx from the National Covid Task Force explaining this, and saying that other countries don't count Covid deaths this way.
https://www.realclearpolitics.com/video/2020/04/08/dr_birx_unlike_some_countries_if_someone_dies_with_covid-19_we_are_counting_that_as_a_covid-19_death.html
Here is the Illinois Health Director saying the same thing:
https://week.com/2020/04/20/idph-director-explains-how-covid-deaths-are-classified/
Seeing that nearly three million people die from all causes every year, and perhaps a third of the population has contracted the disease, you can see that by pure chance, at least a couple hundred thousand people who were dying anyway contracted the disease by random chance, and it had nothing to do with their death.
If you want to reply, then register here. Registration is free and your account is created instantly, so you can post right away.