Lying has become the new "normal"
May 16, 2021 17:40:02 #

May 16, 2021 18:13:46 #
May 17, 2021 04:07:41 #

May 17, 2021 08:13:07 #

tradio wrote:
Just where does one get reliable news?
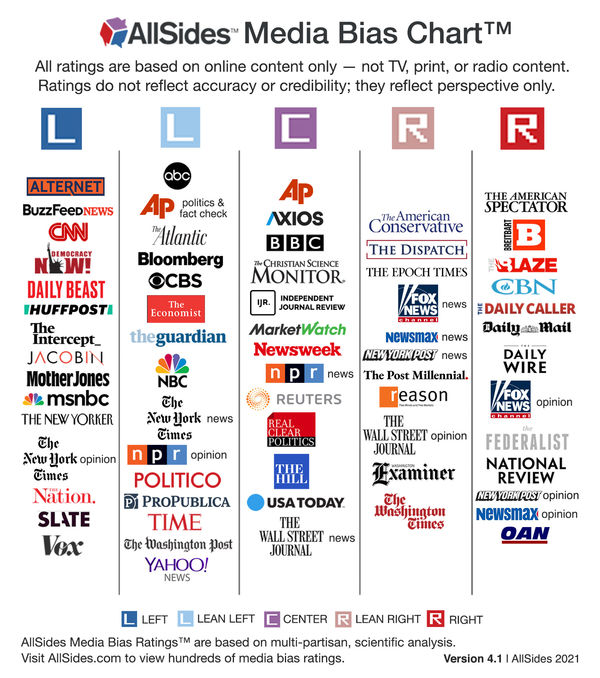
Try looking under the "C".
May 17, 2021 08:47:36 #
gorgehiker
Loc: Lexington, Ky
Kraken wrote:
Try looking under the "C".
Thanks for posting this helpful chart.
May 17, 2021 09:42:21 #

May 17, 2021 10:19:06 #
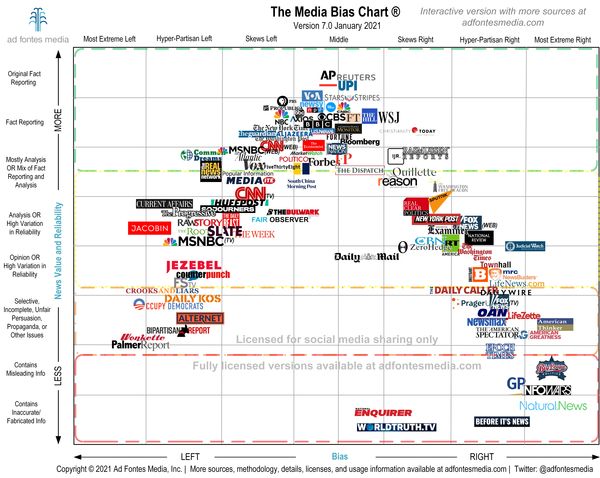
It’s very interesting to see the changes over time. It’s important to distinguish between news reporting and opinion, but also defines the junky, even dangerous, ones. If you stick to the top middle cluster of agencies, you’ll get exposed to left, central and right reporting of news.
https://www.adfontesmedia.com/gallery/
https://www.adfontesmedia.com/gallery/
May 17, 2021 10:23:35 #

Kraken wrote:
Try looking under the "C".
We the American people can see BS when it is presented to us especially from a foreign L*****t source.
This chart gives a harmful and false assumption that those sources in the middle have completely no bias. It may be OK for Canadians but it is BS here.
ALL those news services listed under the "C" should be shifted to the Left and some far left with maybe the exception of the WSJ.
And CNN, the most openly documented L*****t biased source of all being slightly left of center is itself blindingly biased.
In 2021, an article on the Association of College and Research Libraries' blog argued that the Media Bias Chart is detrimental to media literacy efforts because it "promotes a false equivalency between left and right, lionizes a political 'center' as being without bias, and reinforces harmful perceptions about what constitutes 'news' in our media ecosystem."
May 17, 2021 10:37:49 #
Fotoartist wrote:
We the American people can see BS when it is prese... (show quote)
And this is how the "new normal" began and now thrives.
May 17, 2021 11:20:46 #
DukeTarHeel wrote:
And this is how the "new normal" began and now thrives.
What you’re referring to is one article on one blog and not the position of the research profession. These charts are part of most library science courses. They add t***sparency to media outlets.
Another technique used to avoid bias is the disclosure of affiliations that may be considered a possible conflict of interest. This is especially apparent when a news organization is reporting a story with some relevancy to the news organization itself or to its ownership individuals or conglomerate. Often this disclosure is mandated by the laws or regulations pertaining to stocks and securities. Commentators on news stories involving stocks are often required to disclose any ownership interest in those corporations or in its competitors.
https://www.adfontesmedia.com/what-the-acrl-blog-critique-misses-about-the-media-bias-chart/
https://www.poynter.org/fact-checking/media-literacy/2021/should-you-trust-media-bias-charts/
https://libguides.depauw.edu/c.php?g=1074183&p=7822994
https://www.thegoodtrade.com/features/media-bias-fact-check
Are we even aware of our biases anymore?
If you look at this chart and are convinced your “extreme” source belongs in the middle, you just might be part of the problem plaguing America today.
https://www.marketwatch.com/story/how-biased-is-your-news-source-you-probably-wont-agree-with-this-chart-2018-02-28
May 17, 2021 11:56:04 #
Triple G wrote:
What you’re referring to is one article on one blo... (show quote)
You say this chart is in, "Library science courses and they add t***sparency to media outlets." If it's in a higher education science course then that just tells you why and how many colleges are being corrupted with Leftism.
What makes this chart any less biased than the media it seeks to rate?
Just look at the media in the center. PBS, BBC, CBS, and most others are not Center biased media. Anyone with a waking brain knows this. Most of them gave Donald Trump 90% negative coverage for four years and they are now giving Biden 80% positive coverage after 4 months.
In fact if you also notice, the chart appears to have an equal number of media on the Left as well as the Right. This just is not true. There is not that much Right leaning media out there. Again anyone with half a brain knows that 80% of the media is L*****t.
May 17, 2021 12:08:48 #
Fotoartist wrote:
You say this chart is in, "Library science co... (show quote)
I’ll just repeat the MarketWatch quote because it certainly pertains to you..
Do you really believe that a library science teacher is showing this chart and saying students should agree with it 100%. If you do, you’re unaware of how researchers are taught to examine every nuance of their findings. It’s learning how to identify biases, including their own, that’s taught. You should take a class offered by your local senior center or library on discerning bias in media to see for yourself.
https://americanlibrariesmagazine.org/2016/12/27/fighting-f**e-news/
https://guides.lib.k-state.edu/breakingyournewsbubble/breaking
https://guides.lib.ku.edu/medialiteracy/faculty
https://www.collegian.psu.edu/news/campus/stick-to-the-facts-penn-state-students-professor-weigh-in-on-media-bias/article_de7986e8-125c-11eb-876a-a73b261490bb.html
May 17, 2021 12:56:05 #
May 17, 2021 13:08:07 #

Fotoartist wrote:
And CNN, the most openly documented L*****t biased source of all being slightly left of center is itself blindingly biased.
And CNN, the most openly documented L*****t biased source of all being slightly left of center is itself blindingly biased.
Uh, CNN is listed as far left...
May 17, 2021 13:10:50 #
mwalsh wrote:
Uh, CNN is listed as far left...
If you look at each iteration of the chart, you’ll see interesting additions, deletions, and movement of well-known media outlets. They aren’t static representations.
If you want to reply, then register here. Registration is free and your account is created instantly, so you can post right away.