JPG comparisons revisited
Jan 22, 2021 11:57:17 #
Back in November I posted a study of the effect of multiple rewrites on jpg files. https://www.uglyhedgehog.com/t-672440-1.html#11714204
One thing I tried to do was to produce a quantitative comparison of the original file to a jpg after multiple rewrites. I used the luminance of the image for the comparison, based on the square root of (R^2+G^2+B^2) where R,G, and B are the Red, Green, and Blue channels. I looked at both images and found the RMS difference between the luminance in the two images at each pixel. That gave me a number that I could use to express the change due to the jpg compression applied multiple times.
After thinking a bit about it, I realized that most of us don't have the computer skills to do that analysis and I don't have the skill to write a program that would be general enough that anyone could use it. So most people will have to stick with putting two images side by side and looking for differences. If you have a fast enough viewing program you can use a blink test, where you switch back and forth between two images and look for elements that blink, indicating a difference between the images. I use IrfanView for that, but that's Windows only so you Mac guys are left out there (although there may well be similar Mac software with which I am unfamiliar that would do the job).
Also, when looking at a multimegapixel image, it's hard, even with a blink test, to spot where the differences occur. Large areas of uniform color may show posterization, but more frequently in the images I used for testing, the large uniform areas appeared to be where the differences were insignificant. So I rewrote the comparison program to split the original image up into bits so I could get the RMS differences at different points in the image.
I took a test image and when calculating the luminance changes I stored the data in a 10 x 10 array based on the location of the comparison pixels. That gave me a rough map of differences so I would know where to look when doing a blink test. Preliminary results are shown below.
For those of you who might want to look for differences without numerical analysis, there is a test you can do in Photoshop or equivalent layer enabled software. Load the original and the multiply written copy into separate layers in Photoshop. Change the blending mode on the top layer to difference. That will give you an image showing the differences in individual pixels. You might have to increase the brightness of the image to see anything but you will probably find that the real differences lie on the edges in the images.
When you do that, you will see color information that I ignored in my original study. The luminance information is probably more important but it may be worth looking at the color differences too. I will take that as a future project.
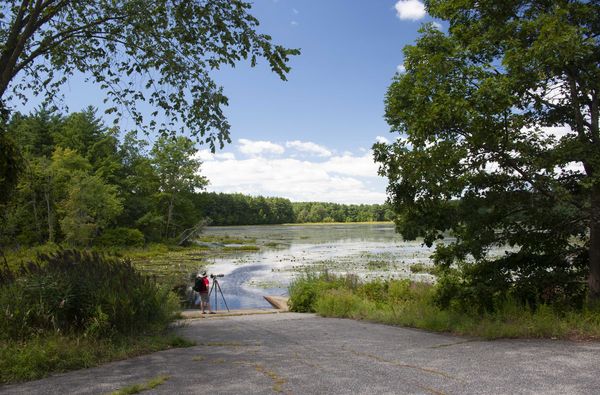
The original test image I used was a tif file, which is too large to load on UHH. I put it on Dropbox at https://www.dropbox.com/s/sms0w121z16lnid/Image2.tif?dl=0. Shown below are the jpg file after 40 rewrites and the map showing where the main differences lie. Black is no difference and red is maximum difference. The peak luminance in the image is about 440 and the RMS differences in the selected areas range from 4 to 15.
Also shown is an example of the Photoshop comparison. Note in the panel on the right that I have pumped up the brightness using levels. The white point is set at 5 instead of 255 so the brightness is increased by a factor of about 50.
.
One thing I tried to do was to produce a quantitative comparison of the original file to a jpg after multiple rewrites. I used the luminance of the image for the comparison, based on the square root of (R^2+G^2+B^2) where R,G, and B are the Red, Green, and Blue channels. I looked at both images and found the RMS difference between the luminance in the two images at each pixel. That gave me a number that I could use to express the change due to the jpg compression applied multiple times.
After thinking a bit about it, I realized that most of us don't have the computer skills to do that analysis and I don't have the skill to write a program that would be general enough that anyone could use it. So most people will have to stick with putting two images side by side and looking for differences. If you have a fast enough viewing program you can use a blink test, where you switch back and forth between two images and look for elements that blink, indicating a difference between the images. I use IrfanView for that, but that's Windows only so you Mac guys are left out there (although there may well be similar Mac software with which I am unfamiliar that would do the job).
Also, when looking at a multimegapixel image, it's hard, even with a blink test, to spot where the differences occur. Large areas of uniform color may show posterization, but more frequently in the images I used for testing, the large uniform areas appeared to be where the differences were insignificant. So I rewrote the comparison program to split the original image up into bits so I could get the RMS differences at different points in the image.
I took a test image and when calculating the luminance changes I stored the data in a 10 x 10 array based on the location of the comparison pixels. That gave me a rough map of differences so I would know where to look when doing a blink test. Preliminary results are shown below.
For those of you who might want to look for differences without numerical analysis, there is a test you can do in Photoshop or equivalent layer enabled software. Load the original and the multiply written copy into separate layers in Photoshop. Change the blending mode on the top layer to difference. That will give you an image showing the differences in individual pixels. You might have to increase the brightness of the image to see anything but you will probably find that the real differences lie on the edges in the images.
When you do that, you will see color information that I ignored in my original study. The luminance information is probably more important but it may be worth looking at the color differences too. I will take that as a future project.
The original test image I used was a tif file, which is too large to load on UHH. I put it on Dropbox at https://www.dropbox.com/s/sms0w121z16lnid/Image2.tif?dl=0. Shown below are the jpg file after 40 rewrites and the map showing where the main differences lie. Black is no difference and red is maximum difference. The peak luminance in the image is about 440 and the RMS differences in the selected areas range from 4 to 15.
Also shown is an example of the Photoshop comparison. Note in the panel on the right that I have pumped up the brightness using levels. The white point is set at 5 instead of 255 so the brightness is increased by a factor of about 50.
.
JPG after 40 rewrites
(Download)
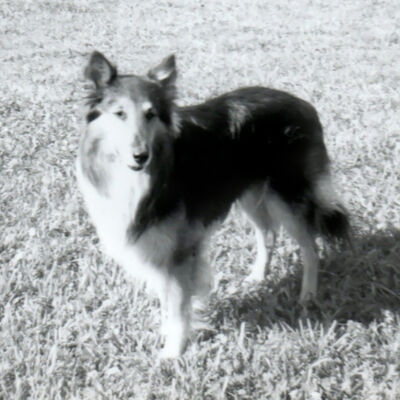
Difference map between original tif and multi-saved jpg

(Download)

(Download)
Jan 22, 2021 12:07:32 #

DirtFarmer wrote:
Back in November I posted a study of the effect of... (show quote)
Your test doesn't really prove much of anything because that's not what people do to lose image quality on a jpg image. Try taking a jpg image into Photoshop and doing a few major adjustment like "curves" or "saturation" and then flatten and save. Then open the same file and do those adjustments in reverse and then flatten and save. Do this a few times and you'll be able to see how a jpg falls apart with each save. It's not going to be a lot, but some people take a jpg that is off from the start and needs a lot of editing. They try to edit using a lot of layers and the image starts to fall apart. That's because it's an 8-bit image and doesn't have the massive amount of data that a raw, tif, or psd has in 16-bit....
Jan 22, 2021 12:55:02 #
jeep_daddy wrote:
Your test doesn't really prove much of anything be... (show quote)
That's not what people do either. Generally, rather than save as a jpg and re-save over top of itself, if an image is going to have lots of changes, you would save as a development file, that way you can save all you want with no loss of quality. With PS save as a .psd file, Affinity, save as .psd or as .afphoto file, or ACDSee as an .acdc file. These formats are there for a reason. Mainly to not lose your edits, and also not to lose data with multiple saves.
My guess is most quality problems with jpg occur due to high compression levels, not saving the same file over top of itself multiple times.
I have done the "blink" test just for laughs and vaguely recall saving around 10 times and not noticing any problems. 40 times would be crazy. I virtually never saved a jpg on top of itself until after I did my own personal "blink" test and proved to myself that a few jpg saves at low compression levels would not be noticeable at all. I still rarely do something like that unless I don't really care all that much about the image. I have never once done it enough to notice any difference.
Jan 22, 2021 12:56:06 #
jeep_daddy wrote:
Your test doesn't really prove much of anything be... (show quote)
What you're describing is not what I'm doing. I am just taking a jpg, then saving it as a new file without any changes. In this example I did that 40 times. All the changes that happen are due to the recompression. The original study was done because so many people were saying that a jpg will continue to degrade due to compression every time it is rewritten. My study showed that the degradation would saturate after several rewrites. The number of rewrites required varied with the image and the "quality" setting used in the compression algorithm. The algorithm is different with different software.
If I were going to re-edit an image I would always start with the original image.
The real object of this is to find a good way to compare images. For that reason I purposely used a process that would produce changes in the image, but a process that some people might use without thinking about it. e.g. I have an image. I send it to another guy. He makes a new image (not just a digital copy) and sends it to another guy. That process gets repeated and the guy who gets an image after it goes through this process a few times gets an image that has changes due to multiple recompressions.
The Photoshop example is one way to compare the two images. I didn't do it to edit the image, only to see the difference. After 40 rewrites of a jpg, the luminance values have changed less than 2% at most (based on the Photoshop comparison) and based on the numerical analysis the change was between 1% and 3%.
Furthermore, the rewrites of the jpg were done in IrfanView with a "quality" setting of 50 (out of 100 max). I can start to see differences in jpgs by eye (with a blink test) after images have been saved multiple times at "quality" settings less than 40.
PS: the rewrites were done with a computer script. I did a number of tests at 100 saves and one time got up to 900. The computer did the work while I did something else.
Jan 22, 2021 13:37:22 #
BigDaddy wrote:
That's not what people do either. Generally, rath... (show quote)
I know, but inexperienced people do that sometimes. I know how I'd do it if I only had a jpg and it was bad to begin with. I know I can improve a bad jpg, but sometimes you simply can't make it perfect. That's why I shoot raw, when I process them and use layers I save the layered version as a psd and then export or save-as a jpg to show other people in an email, or upload to the web in sRGB. I don't like processing jpgs and avoid it when possible. But when I first started doing this extensively back in 2010, I shot only jpg and made many mistakes.
Jan 23, 2021 09:08:07 #

BigDaddy wrote:
That's not what people do either. Generally, rath... (show quote)
Or you could do your edits in Lightroom Classic which reverts to the original out of the camera file. If you normally edit raw images you will experience culture shock when you discover some sliders and adjustments have vanished.
Jan 23, 2021 09:18:34 #
I should think that the "quality" setting of the jpeg save settings would be of great importance here. Most editors seem to use the 80% figure as a default. Even a single save at a low figure, say 20%, will show terrible degradation of the image, and yield a very small file size.
Conversely, a 100% setting will yield a very large file size while dumping very little of the original data. It seems intuitive that a high quality setting would blunt any negative impacts of repeated saves, while lower settings would make the image more vulnerable to visible damage.
Conversely, a 100% setting will yield a very large file size while dumping very little of the original data. It seems intuitive that a high quality setting would blunt any negative impacts of repeated saves, while lower settings would make the image more vulnerable to visible damage.
Jan 23, 2021 10:11:54 #
Bayou wrote:
I should think that the "quality" setting of the jpeg save settings would be of great importance here. Most editors seem to use the 80% figure as a default. Even a single save at a low figure, say 20%, will show terrible degradation of the image, and yield a very small file size.
Bayou wrote:
Conversely, a 100% setting will yield a very large file size while dumping very little of the original data. It seems intuitive that a high quality setting would blunt any negative impacts of repeated saves, while lower settings would make the image more vulnerable to visible damage.
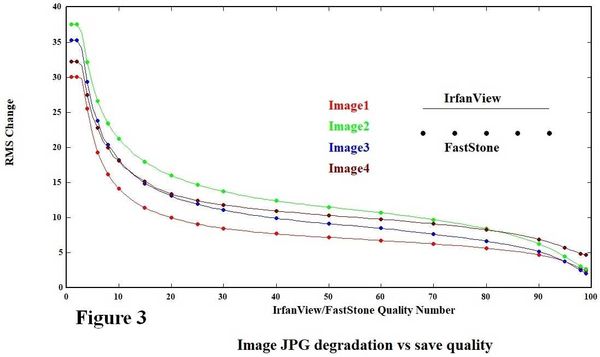
From https://smallfarm.netfirms.com/Documents/JPG%20Compression%20Study.pdf
.
Degradation of image as a function of quality setting for IrfanView and FastStone
(Download)
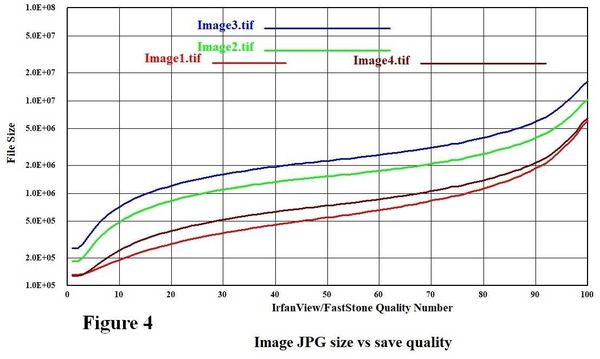
Size of jpg converted from tif as a function of quality setting (IrfanView)
(Download)
Jan 23, 2021 11:16:48 #
Jack 13088 wrote:
Or you could do your edits in Lightroom Classic which reverts to the original out of the camera file. If you normally edit raw images you will experience culture shock when you discover some sliders and adjustments have vanished.
I keep all my original jpgs with zero modifications, and if I do any edits more than simple basic edits, I keep the development file as well. I also keep edited jpg copies of good stuff in various sizes for display on TV/Cell phone, Desktop background, and a counter top display as well as a full size edited jpg for no particular reason. If I shoot raw, I do the same thing.
As for sliders missing in Lightroom, I noticed long ago that PS (CS2 was the last version I used) had no adjustment tool for white balance (among others). This meant you needed to adjust color tones and stuff with other tool combinations, which could be a daunting task. Other editors, like the ACDSee editor had a specific jpg tool for white balance that made it a snap to adjust white balance with sliders, and it has a color picker tool where you can select any color on the photo, and it will adjust WB based on that color. It's fun to fool around with and you can actually see how your camera auto white balance made it's decisions. I often thought this "lack of sliders" caused people to think raw was the only way to go. There are good reasons to shoot raw but jpg degradation isn't one, nor is the ability to adjust WB.
As far as Dirtfarmers testing of jpg degradation, it's a noble cause, but the math of it kind of gives me a headache. For me, the "blink" test is what counts, and that goes for both degradation based on compression, or saving the same file 40 times, as well as RAW files vs JPG files. Generally, in photography, if I can't see it, particularly with a "blink" test (which really highlights changes), then I really don't care. Most of my pictures I save at 60-80% compression for display on electronic media. For a rare print, I don't compress at all.
Jan 23, 2021 11:33:15 #
BigDaddy wrote:
...As far as Dirtfarmers testing of jpg degradation, it's a noble cause, but the math of it kind of gives me a headache...
One reason (not the primary reason) I did the study was to get some proficiency in the Python programming language. At my age I don't learn things as fast as I used to, but I'm getting some ability to generate programs to do interesting things.
And it gives me something to do on cold winter days and/or in quarantine.
BigDaddy wrote:
...As for sliders missing in Lightroom, I noticed long ago that PS (CS2 was the last version I used) had no adjustment tool for white balance (among others)...
Haven't used CS2 in quite a while, but in the current PS you can use Filter -> Camera Raw Filter, which will bring up a dialog that has Temperature and Tint sliders. There is also an eyedropper tool that will allow you to select a spot that you can force to white. I usually do that in LR, but it works in PS. You can apply it to one layer. I suspect (but haven't tried) that you could mask it as well to change the white balance differentially.
BigDaddy wrote:
I keep all my original jpgs with zero modifications, and if I do any edits more than simple basic edits, I keep the development file as well. I also keep edited jpg copies of good stuff in various sizes for display on TV/Cell phone, Desktop background, and a counter top display as well as a full size edited jpg for no particular reason. If I shoot raw, I do the same thing.
Always good to keep the original safe, no matter what format it is.
Jan 23, 2021 13:51:56 #
Jan 24, 2021 00:09:02 #
If you want to reply, then register here. Registration is free and your account is created instantly, so you can post right away.