Highlight Weighted Metering - When is it right?
Jan 11, 2021 15:46:59 #
Strodav
Loc: Houston, Tx
cbtsam wrote:
I don't know about "old school," but I'm... (show quote)
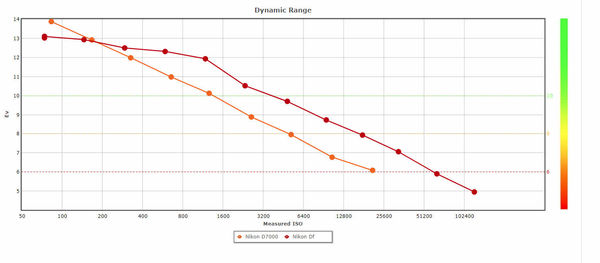
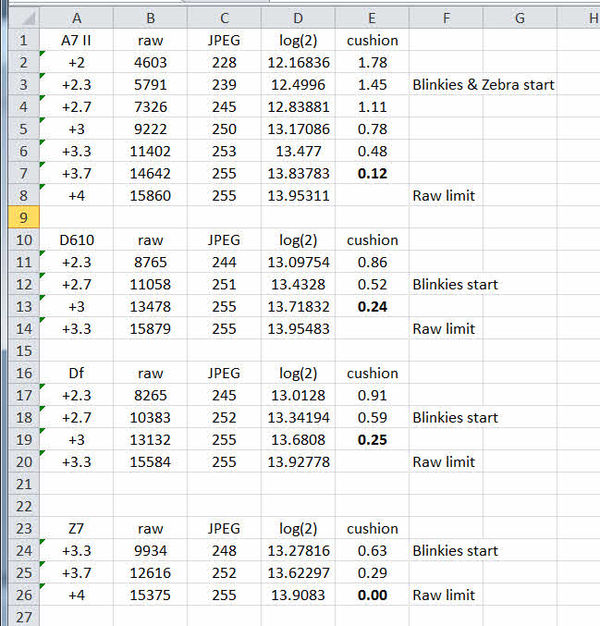
Dynamic Range (DR) is defined as the difference between the darkest and lightest tones in a scene. A change in one EV is a doubling of the brightness. What the curve shows is how much DR a camera sensor can capture at a particular ISO setting. The largest DR a camera sensor can capture are at base ISO and maybe a stop more. After that, the DR the camera sensor can capture drops off quickly. Digital cameras deliver their best image quality at base ISO.
BTW, this is old school. I picked this up shooting film in a Canon AE1 around 1979.
Problems occur when the DR of the scene is greater than the DR of the sensor at a given ISO. The blinkies are there to warn you of this. There are a few things you can do in these situations. One is to choose to capture shadow detail at the expense of blowing out the highlights. Another is to capture highlight detail at the expense of burying the shadows. Many of us bracket to catch both shadows and highlights in separate shots and fix (merge) in PP. Some cameras have HDR settings to try and deal with it in the body. Personally, I'd rather drop my ISO to capture the scene's DR if possible, if not, then bracket.
You can use spot metering to find the dynamic range of your scene then apply the DR curve to see what "remedies" are appropriate.
Jan 11, 2021 16:13:24 #
Strodav wrote:
Dynamic Range (DR) is defined as the difference be... (show quote)
First, thanks so much for taking the time to help me out.
As I get it, then, "EV" in your graph is actually something like "Recordable EV Range," or the number of stops between the brightest and dimmest brightness values in the scene that can be recorded, analogous to the "zones" of Ansel Adams' system. Thus, at ISO 50 on my D850, I can expect to be able to record as much as nearly but not quite 15 distinguishable stops or zones from dimmest to brightest, as measured say by spot metering, while at ISO 80, I can only expect to record a bit over 14 stops from dimmest to brightest, and at ISO 800 I can expect to be able to record about a 12 stop range, and at ISO 5000, I'm down to a bit less than 10 stops.
Have I understood this much correctly, or am I still totally in the dark? If still in the dark, it would be nice if you could further instruct me.
In either case, what is the significance of (1) the color bar off to the right margin of your graph, (2) the fact that the horizontal line at EV=6 is dotted instead of solid, and (3) the fact that the curve doesn't go lower than EV=6?
Let me thank you in advance for any further instruction you can provide to me.
Jan 11, 2021 16:28:22 #
cbtsam wrote:
... what is the significance of (1) the color bar off to the right margin of your graph, (2) the fact that the horizontal line at EV=6 is dotted instead of solid, and (3) the fact that the curve doesn't go lower than EV=6? ...
The color bar on the right is an indication of increasingly noticeable noise.
The dotted line is simply an arbitrary limit beyond where you are just about guaranteed to see noise all over the image. Some sensors don't reach that line and some go past it.
If you measure from the DR line down to the EV6 line you will have an indication of just how much relatively noise free DR the camera actually has.
Here is another example.
Jan 11, 2021 18:10:41 #
Strodav
Loc: Houston, Tx
cbtsam wrote:
First, thanks so much for taking the time to help ... (show quote)
Looks like you got it right. Selmslie explained the color bar to the right. I should have mentioned the graph came from DxOMark.com.
Jan 11, 2021 18:40:53 #
Jan 11, 2021 19:04:57 #
a6k
Loc: Detroit & Sanibel
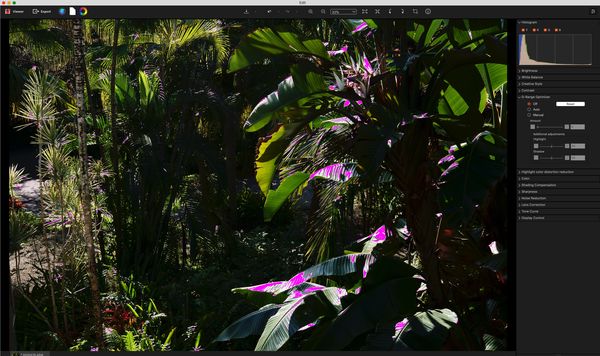
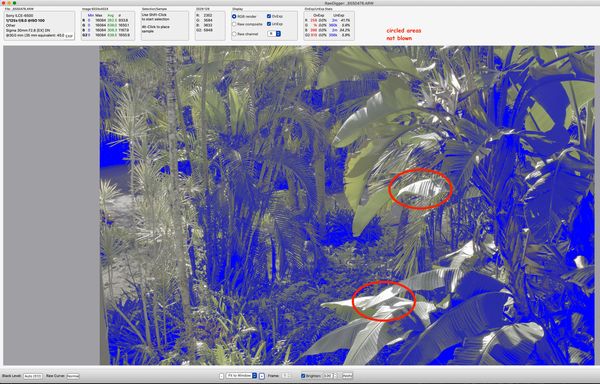
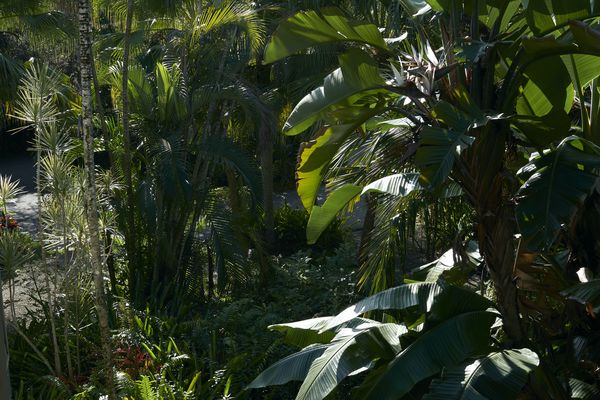
I took this shot before noon today. It exceeds the DR of the sensor. My Zebra warnings were present in a few spots where leaves were reflecting sunlight.
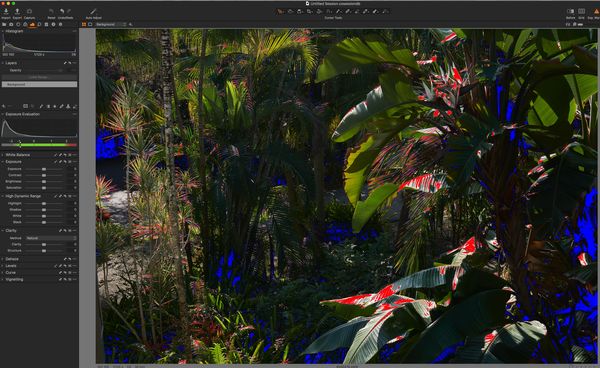
FastRawViewer, Sony Edit and CaptureOne were saying some spots were blown. Raw Digger found only some very tiny spots where that was so. I exported a JPG from CaptureOne and sure enough, the JPG could not handle those spots. But they could have been saved by processing the raw file. The circled areas in RawDigger are not shown as blown but they are close to the limit.
Exposure was ISO 100, aperture preferred, camera controlled shutter speed.
FYIO
Jan 11, 2021 20:07:08 #
a6k wrote:
I took this shot before noon today. It exceeds the... (show quote)
RawDigger indicates that about 2600 pixels out of 24MP were blown about 0.01% of the total pixels. That's not significant since they were all specular highlights.
There is no telling how much less exposure it would have taken to get that down to 0 but it's probably not worth it since it would have probably brought the shadows down too far.
Jan 11, 2021 20:31:55 #
a6k
Loc: Detroit & Sanibel
selmslie wrote:
RawDigger indicates that about 2600 pixels out of 24MP were blown about 0.01% of the total pixels. That's not significant since they were all specular highlights.
There is no telling how much less exposure it would have taken to get that down to 0 but it's probably not worth it since it would have probably brought the shadows down too far.
There is no telling how much less exposure it would have taken to get that down to 0 but it's probably not worth it since it would have probably brought the shadows down too far.
I agree that the exposure was correct (at least as I defined it). My point was that the various indications of overexposure are just slightly conservative. Also, the JPG, exported with no editing, had those leaf areas as 255,255,255. The secondary point is that JPG SOOC deprives one of the opportunity to take maximum advantage of the camera. A bit of post-processing starting with a linear view of the raw file instead of the standard curve would make it possible to use those almost-blown areas.
It's just an example with some empirical data for those who might be interested. My Sony Zebra setting was either +107 or +109 so it's right where it needs to be.
And I agree with Scotty that if the DR were less extreme that the whole ETTR exercise here would have been a waste of effort. But here it made sense to use the tools that Sony provided.
Jan 11, 2021 20:43:22 #
a6k wrote:
I agree that the exposure was correct (at least as I defined it). My point was that the various indications of overexposure are just slightly conservative. Also, the JPG, exported with no editing, had those leaf areas as 255,255,255. ...
The difference between where the raw file blows out and the JPEG reaches 255 is probably less than 0.25 stops depending on the camera.
Jan 11, 2021 20:47:08 #
a6k
Loc: Detroit & Sanibel
selmslie wrote:
The difference between where the raw file blows out and the JPEG reaches 255 is probably less than 0.25 stops depending on the camera.
I would have to go back to my examples to evaluate your assertion about 1/4 stop. BUT that little difference is all it takes to make good recovery and good results possible or impossible. In that case, if I'm right, it's an important difference.
Just my view of it (2¢).
If you want to reply, then register here. Registration is free and your account is created instantly, so you can post right away.