The effect of diffraction on sharpness
Jan 11, 2019 16:52:16 #

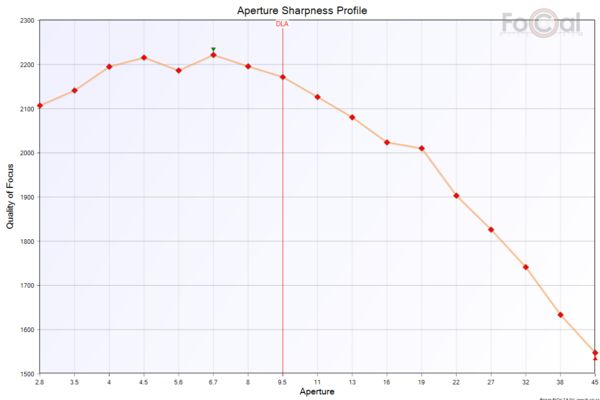
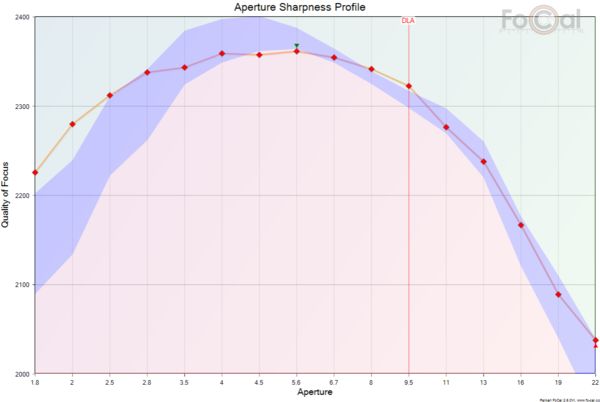
The newest version of Reikan’s Focal lens calibration SW includes analysis of sharpness vs aperture. Following are a few graphs plotting aperture vs sharpness for several of my Canon full frame lenses after calibration. A couple of observations: the effects of diffraction are clear (beyond f11 on FF), and the old adage of stopping down a stop or two from wide open for max sharpness is pretty accurate, but depends on the lens.
135 f2L
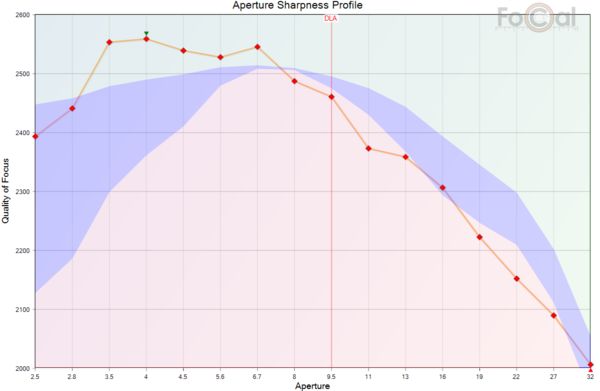
85 f1.8
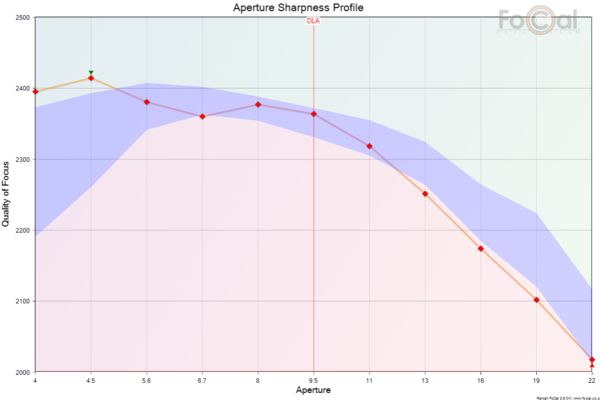
50 f2.5 macro
24-105 f4L @105mm
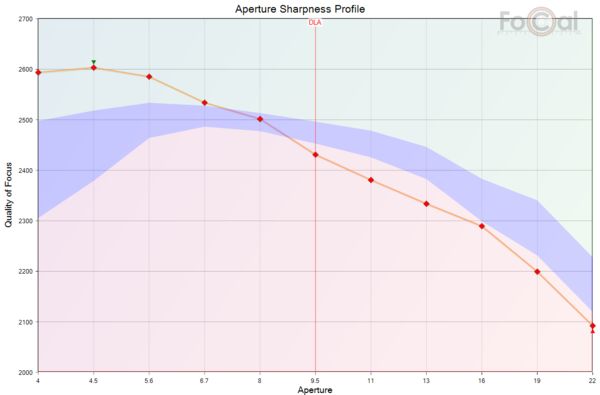
24-105 f4L @24mm
Jan 11, 2019 16:56:13 #
Jan 11, 2019 16:58:15 #
Jan 11, 2019 17:09:48 #
Jan 11, 2019 17:12:45 #

TriX wrote:
The newest version of Reikan’s Focal lens calibration SW includes analysis of sharpness vs aperture. Following are a few graphs plotting aperture vs sharpness for several of my Canon full frame lenses after calibration. A couple of observations: the effects of diffraction are clear (beyond f11 on FF), and the old adage of stopping down a stop or two from wide open for max sharpness is pretty accurate, but depends on the lens.
Exactly what you might expect... Most of the charts of most of the lenses I've seen have graphs that are shaped very similarly. The highest, flattest part of the graph is usually a sweet spot that's two to four f/stops wide. The DLA is usually about the same on all lenses used with a given sensor. There are notable exceptions, but most lenses perform predictably the same way (although the overall height of the entire graph varies a lot, depending on the quality of the lens!).
Jan 11, 2019 17:18:23 #
burkphoto wrote:
Exactly what you might expect... Most of the charts of most of the lenses I've seen have graphs that are shaped very similarly. The highest, flattest part of the graph is usually a sweet spot that's two to four f/stops wide. The DLA is usually about the same on all lenses used with a given sensor. There are notable exceptions, but most lenses perform predictably the same way (although the overall height of the entire graph varies a lot, depending on the quality of the lens!).
I really like being able to test MY lenses (rather than relying on a published graph) - that way you KNOW the performance and if you get a bad copy right up front and the fact that it correlates very nicely with actual results. My 135 f2L plus a Canon 1.4x MKII TC (~190mm) looks noticeably sharper wide open than my 70-200 f2.8L at 200mm f2.8, and the tests show exactly that.
Jan 11, 2019 17:38:27 #
TriX wrote:
I really like being able to test MY lenses (rather than relying on a published graph) - that way you KNOW the performance and if you get a bad copy right up front and the fact that it correlates very nicely with actual results. My 135 f2L plus a Canon 1.4x MKII TC (~190mm) looks noticeably sharper wide open than my 70-200 f2.8L at 200mm f2.8, and the tests show exactly that.

Yeah, specifics matter. I generally test my lenses with a newspaper on a wall under controlled lighting. Making exposures of 8-point text on a full sheet of newsprint at 1/3 stop intervals throughout the range provides a lot of real-world perspective. Generally, I see the same sort of performance that dpreview.com or dxomark.com might post.
If you want to reply, then register here. Registration is free and your account is created instantly, so you can post right away.