Posting a test chart...
Apr 3, 2021 14:22:33 #

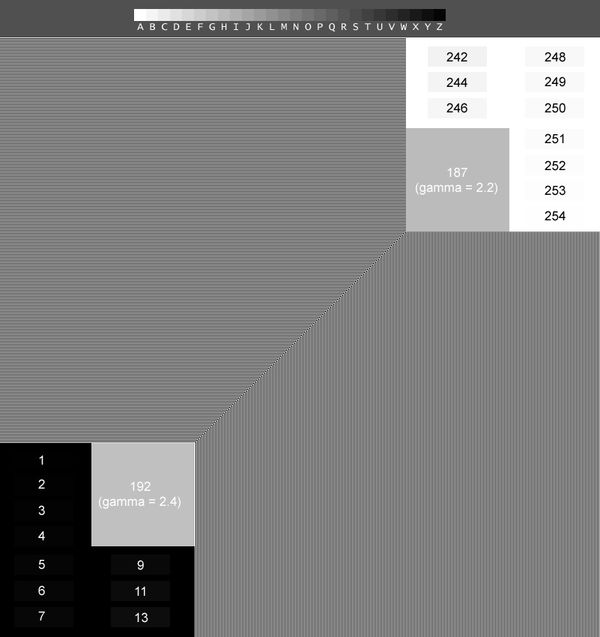
A test chart is always good to have but have you ever used on in PP to see what are the issues when you rotate, resize or do anything that changes the pixel location or value?
Well, download the chart and do your own experimentation with it.
Well, download the chart and do your own experimentation with it.
Apr 4, 2021 08:23:16 #
Interesting chart. Look at the downloaded image and zoom in and out to see what it looks like on the screen. (on Windows use ctrl-plus or ctrl-minus to zoom in and out. Don't know what you use on a Mac but it should be possible). Haven't tried to process it yet.
PS: Ctrl-zero gets you back to normal screen view.
PS: Ctrl-zero gets you back to normal screen view.
Apr 4, 2021 09:41:39 #
Best bet to test what your edits do is to open this chart Then try the usual tools you use on it, first the global such as fixing the horizon, stuff like that.
You will be surprised on how quickly a sharp image to begin with (the chart is) loses details.
Sure, this is an extreme and made to show the issues but keep in mind that while nearly invisible in the real world this takes place regardless of what you do.
This is not to discourage anyone but to be informative.
If you want to reply, then register here. Registration is free and your account is created instantly, so you can post right away.