The Story of The Two Bears, A Light Meter, Camera, and Macbeth Color Chart
Jun 27, 2020 09:36:53 #
As you know, An exposure meter is a device used to measure the amount of light. Whether incorporated in the camera or held in the hand, an exposure meter is relied on to provide the photographer information which will produce the proper exposure for a photograph.
The meter contains a calculator that will provide the correct shutter speed and f-number for proper exposure, for the lighting situation and ISO. But, exposure meters are rather dumb. They have no idea if the photographer is pointing them at the unlit interior of a coal mine or the side of a sunlit hill covered with snow.
What almost all of them will do is provide a combination of f-stop and shutter speed that will photographically render that measured portion of the scene as middle gray, or Zone V. When one gives that due consideration, it makes sense. One would not want to use a meter biased in one direction of exposure or the other. Regardless of the sophistication, the meter will do its best to provide an exposure setting for middle gray.
For Matrix metering, the average of all of the areas measured with produce a middle gray exposure setting. For center-weighted or spot metering, again the meter will provide an exposure that produces middle gray for the area measured.
This means it's up to the photographer to utilize this tool in an optimum manner. Rather than write about the science and mathematics involved in metering, we're going to keep this simple. The illustrations will be photographic.
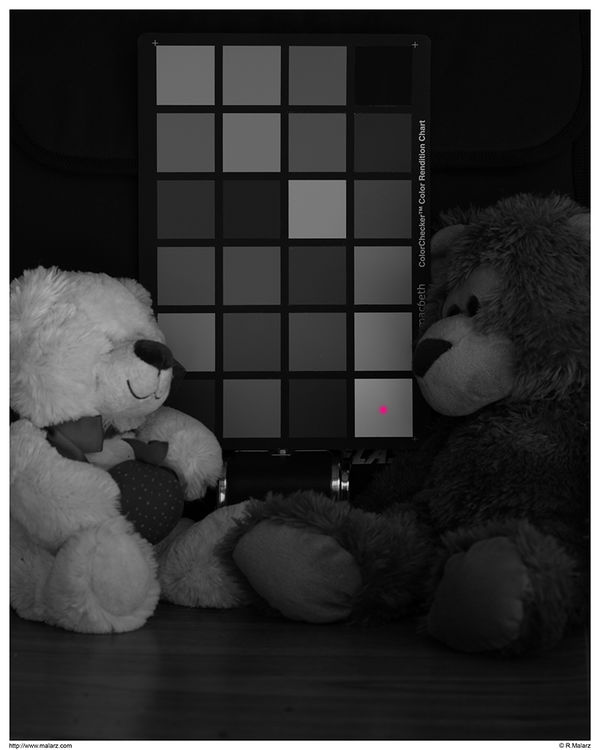
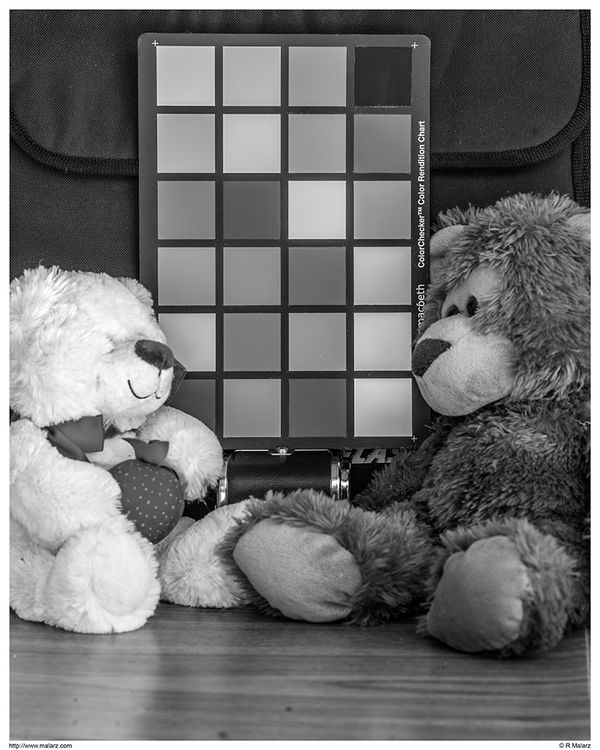
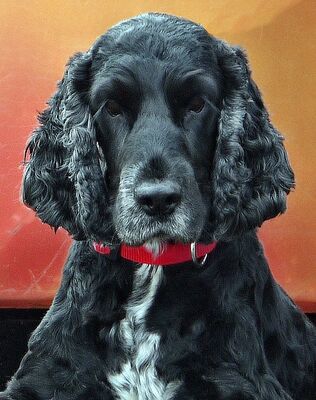
There are 5 photographs attached to this post. They are of the same scene, my two rescue bears, and a Macbeth Color Chart. The difference is how and what was metered.
The parameters:
The scene was shot on an outdoor patio with the open side facing North.
The photographs were taken just a bit past solar noon.
To keep things simple, the sensor has only White Balance and ISO adjustments. The White Balance was set to Auto, the ISO was set to the base ISO of 50 (Base ISO).
Spot meter measurements were taken in the squares indicated by the red dots. However, they were taken approximately 4-5 feet from the target square to approximate taking the exposure "in the field". Thus, some light from outside the spot area could affect the measurement.
Photos 1-4 are SOOC except for black and white conversion. No adjustments were made in that step.
Photograph 1 was metered by measuring the ambient light. This was to establish an 'unbiased standard'.
Photographs 2-4 were spot metered on the indicated squares.
Photograph 5 we'll discuss a bit later.
As can be observed, the exposure based on the black square, No. 2, rendered a photograph that was overexposed. There is a lack of detail in the white area.
The third photograph comes pretty close to the appearance of the ambient light measured photograph, which was somewhat expected, as it was measured using the middle gray square.
The 4th photograph was exposed by measuring the white square and thus produced an underexposed photograph.
Thus, it can be seen that due diligence, in metering the scene, is required for optimal exposure settings. Observations of the "trouble" areas and how they are to be handled are crucial.
The 5th photograph was processed from the same original image as photograph 2. Measurement of the black square resulted in an exposure that was well above the limits of the jpg. However, this is well within the RAW exposure limits (known as ERADR, Extra RAW-Accessible Dynamic Range) of the sensor used and thus could be processed.
If only looking at the in-camera jpg, there would have been exposure warnings in the white areas of the scene. Keep in mind, that's the camera-generated jpg. The RAW data obviously contains sufficient information and can be processed as shown in photograph 5.
The processing involved moving the exposure slider to the left and then adjusting the whites and blacks accordingly. The resulting photograph appears similar to the first and the third, which would be expected. That is, as long as the sensor's capabilities weren't exceeded in the initial capture.
Essentially, this is the same as using ETTR/EBTR techniques. Except that, the white square would be metered and the indicated exposure would be increased by an amount which would be determined by testing the particular sensor used for taking the photograph. This is in no way intended to imply that photo processing software should be used to "fix" mistakes on the photographer's part. ETTR/EBTR is a precise technique when applied appropriately.
--Bob
The meter contains a calculator that will provide the correct shutter speed and f-number for proper exposure, for the lighting situation and ISO. But, exposure meters are rather dumb. They have no idea if the photographer is pointing them at the unlit interior of a coal mine or the side of a sunlit hill covered with snow.
What almost all of them will do is provide a combination of f-stop and shutter speed that will photographically render that measured portion of the scene as middle gray, or Zone V. When one gives that due consideration, it makes sense. One would not want to use a meter biased in one direction of exposure or the other. Regardless of the sophistication, the meter will do its best to provide an exposure setting for middle gray.
For Matrix metering, the average of all of the areas measured with produce a middle gray exposure setting. For center-weighted or spot metering, again the meter will provide an exposure that produces middle gray for the area measured.
This means it's up to the photographer to utilize this tool in an optimum manner. Rather than write about the science and mathematics involved in metering, we're going to keep this simple. The illustrations will be photographic.
There are 5 photographs attached to this post. They are of the same scene, my two rescue bears, and a Macbeth Color Chart. The difference is how and what was metered.
The parameters:
The scene was shot on an outdoor patio with the open side facing North.
The photographs were taken just a bit past solar noon.
To keep things simple, the sensor has only White Balance and ISO adjustments. The White Balance was set to Auto, the ISO was set to the base ISO of 50 (Base ISO).
Spot meter measurements were taken in the squares indicated by the red dots. However, they were taken approximately 4-5 feet from the target square to approximate taking the exposure "in the field". Thus, some light from outside the spot area could affect the measurement.
Photos 1-4 are SOOC except for black and white conversion. No adjustments were made in that step.
Photograph 1 was metered by measuring the ambient light. This was to establish an 'unbiased standard'.
Photographs 2-4 were spot metered on the indicated squares.
Photograph 5 we'll discuss a bit later.
As can be observed, the exposure based on the black square, No. 2, rendered a photograph that was overexposed. There is a lack of detail in the white area.
The third photograph comes pretty close to the appearance of the ambient light measured photograph, which was somewhat expected, as it was measured using the middle gray square.
The 4th photograph was exposed by measuring the white square and thus produced an underexposed photograph.
Thus, it can be seen that due diligence, in metering the scene, is required for optimal exposure settings. Observations of the "trouble" areas and how they are to be handled are crucial.
The 5th photograph was processed from the same original image as photograph 2. Measurement of the black square resulted in an exposure that was well above the limits of the jpg. However, this is well within the RAW exposure limits (known as ERADR, Extra RAW-Accessible Dynamic Range) of the sensor used and thus could be processed.
If only looking at the in-camera jpg, there would have been exposure warnings in the white areas of the scene. Keep in mind, that's the camera-generated jpg. The RAW data obviously contains sufficient information and can be processed as shown in photograph 5.
The processing involved moving the exposure slider to the left and then adjusting the whites and blacks accordingly. The resulting photograph appears similar to the first and the third, which would be expected. That is, as long as the sensor's capabilities weren't exceeded in the initial capture.
Essentially, this is the same as using ETTR/EBTR techniques. Except that, the white square would be metered and the indicated exposure would be increased by an amount which would be determined by testing the particular sensor used for taking the photograph. This is in no way intended to imply that photo processing software should be used to "fix" mistakes on the photographer's part. ETTR/EBTR is a precise technique when applied appropriately.
--Bob
Photo 1 - Ambient Metering
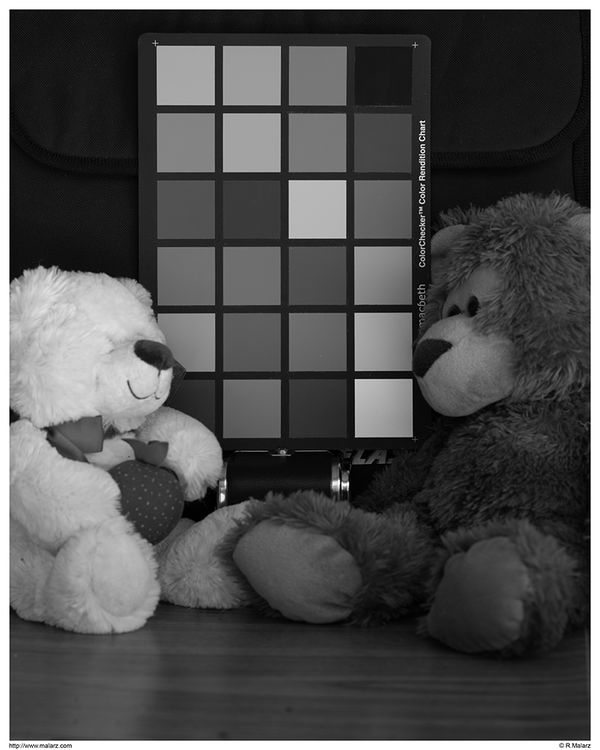
(Download)
Photo 2 - Black Square Metered
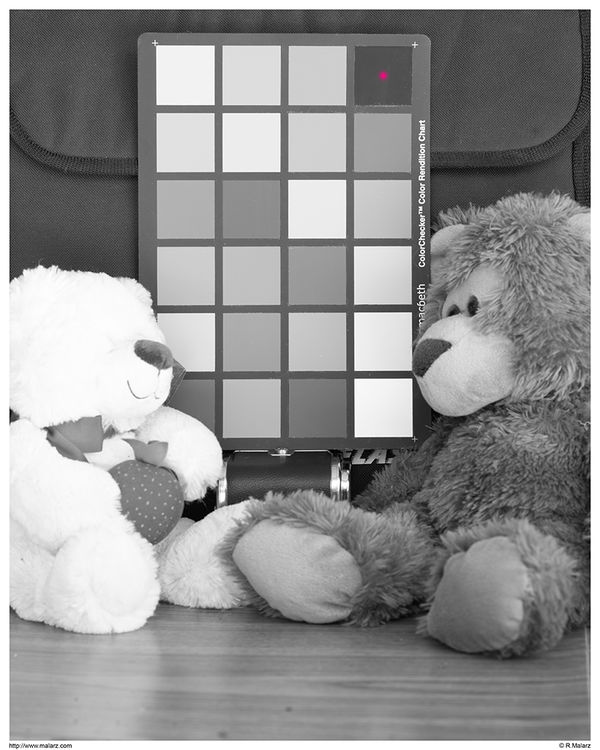
(Download)
Photo 3 - Middle Gray Squre Metered
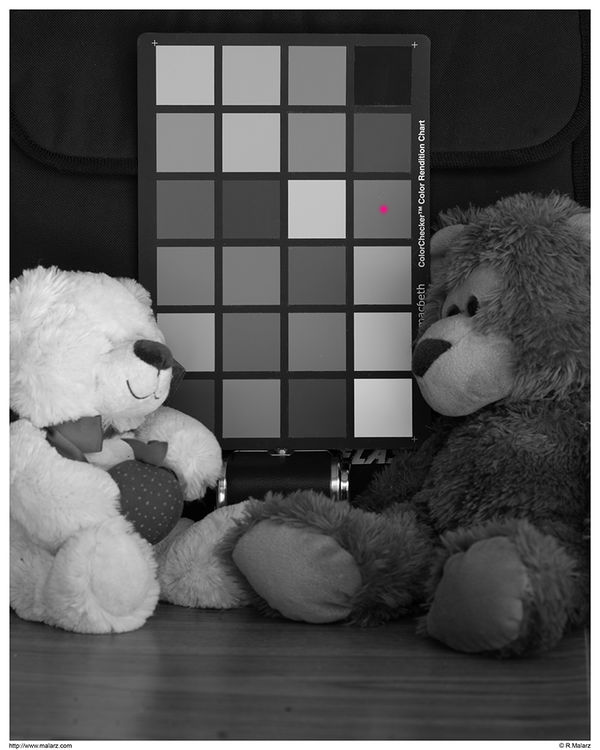
(Download)
Photo 4 - White Square Metered
(Download)
Photo 5 - Processed for ETTR/EBTR
(Download)
Jun 27, 2020 09:48:21 #
Jun 27, 2020 09:53:15 #
Jun 27, 2020 09:56:25 #
You're welcome, John.
--Bob
--Bob
Bulldog1jack wrote:
Thank you for posting this Bob, great explanation!
John
John
Jun 27, 2020 09:57:11 #
I'm trying to keep this somewhat simple. I appreciate your reply. Thanks.
--Bob
--Bob
BebuLamar wrote:
Bob!
The matrix metering doesn't simply average all the points.
The matrix metering doesn't simply average all the points.
Jun 27, 2020 10:22:39 #

rmalarz wrote:
As you know, An exposure meter is a device used to measure the amount of light. Whether incorporated in the camera or held in the hand, an exposure meter is relied on to provide the photographer information which will produce the proper exposure for a photograph. ...
Very nice demonstration.
It would have helped if the actual aperture and shutter speeds had been given so we could see the actual differences in exposure.
About 40 years ago I did a similar test to determine the zone placement for the five other gray squares of my Macbeth color checker in relation to the middle gray square. Your chart appears to be in the same condition as mine was back then. Here is what I got:
Square Stops
1 +2 (white)
2 +1½
3 +1
4 Zone V (middle gray)
5 -1
6 -2½ (black)
So I'm not surprised that when you spot metered the black square you ended up lifting everything by 2½ stops. That's about what you would have done if you had metered the brightest white (maybe brighter than the white square) and dropped the exposure by your customary 2½ stops.
Jun 27, 2020 12:19:42 #
Thanks for stopping by and commenting. A small correction. If I had measured the white square with ETTR/EBTR being the intent, I'd have increased the exposure, not decreased it. The guiding two factors being, in this order, the capability of the sensor I was using. The second would be my interpretive vision of the scene.
--Bob
--Bob
selmslie wrote:
Very nice demonstration. br br It would have he... (show quote)
Jun 27, 2020 12:38:38 #
rmalarz wrote:
Thanks for stopping by and commenting. A small correction. If I had measured the white square with ETTR/EBTR being the intent, I'd have increased the exposure, not decreased it. The guiding two factors being, in this order, the capability of the sensor I was using. The second would be my interpretive vision of the scene.
--Bob
--Bob
You are right. I got the wrong end of the stick.
Jun 27, 2020 12:47:26 #
At least it was a clean end. 
--Bob
--Bob
selmslie wrote:
You are right. I got the wrong end of the stick.
Jun 27, 2020 17:04:09 #
rmalarz wrote:
As you know, An exposure meter is a device used to... (show quote)
Bob,
Congrats!
This is a lucid, well-planned, logically and clearly described as to intent, and effectively executed exercise that cannot but very effectively aid anyone wishing to understand the operating principles underlying metered photographic exposure.
In fact, I’d have to say it is the best “free standing” single-purpose teaching tool on this topic that I have encountered!
And you never once mentioned black and white cats (thought by some to be sine qua non of any such exegesis!)
Damn, man! Job exceedingly well done!
Dave
Jun 27, 2020 17:15:40 #

Jun 27, 2020 20:51:31 #
Thank you very much, Dave.
--Bob
--Bob
Uuglypher wrote:
Bob, br Congrats! br This is a lucid, well-plann... (show quote)
Jun 27, 2020 20:52:30 #
E.L., thank you very much. I appreciate your taking a look and commenting.
--Bob
--Bob
E.L.. Shapiro wrote:
Nice tutorial with good illustrations!  *****
*****
*****Jun 28, 2020 06:19:21 #
Jun 28, 2020 06:54:58 #
If you want to reply, then register here. Registration is free and your account is created instantly, so you can post right away.